Results
This part shows the calculation results. The workspace is able to show diagrams of some characteristics, the table in the bottom part shows the list of calculated results.
Results in the workspace
The workspace may display warping coordinate ω and warping constant Sω. The displayed characteristics may be switched on or off in the tree menu. The font size can be defined in the window "Options", tab "View". Warping characteristics can be drawn for the whole cross-section or only for selected sectors. The option "Only selected" in the tree menu has to be ticked on in this case. The mode for selecting the sectors in the workspace has to be switched on with the help of corresponding button in the toolbar above the workspace. After that, it is possible to select sectors by clicking in the workspace. The selected sectors are highlighted by green colour.
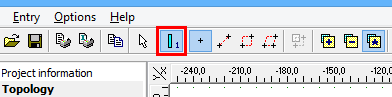 Button "Select sectors"
The toolbar "Selections" can be used when selecting the sectors. Selected sectors are highlighted by green colour.
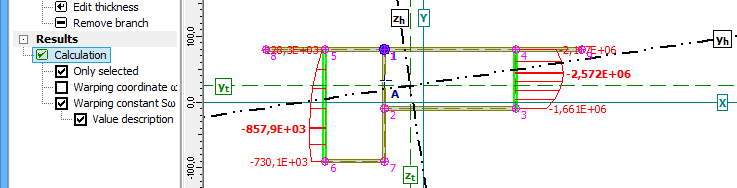 Warping constant on selected sectors
The workspace shows also these results:
- The centre of gravity - this point is located in the intersection of axes yt and zt (dashed lines)
- The shear centre - marked as a point A
- The main axes of the cross-section - bold axes marked yh and zh
The picture in the workspace can be copied into clipboard with the help of shortcut Ctrl+C or the button "![]() " in the toolbar above the workspace. The picture in the clipboard can be pasted into arbitrary document or graphic editor.
" in the toolbar above the workspace. The picture in the clipboard can be pasted into arbitrary document or graphic editor.
Warping coordinates ω in table
Warping coordinates ω in individual nodes are also listed in the table in the left bottom corner. Clicking in the table highlights the appropriate node in the workspace.
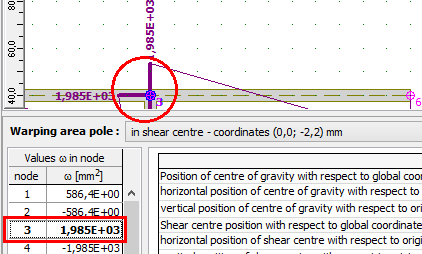 Warping coordinates in the table and in the workspace
Table with results
The bottom frame also contains the table with all calculated characteristics. The data in table can be selected by the cursor and copied into another program (text editor). The table contains a context menu, that can be opened with the help of right mouse button.
The calculated cross-sectional characteristics are described also in the theoretical part of help.
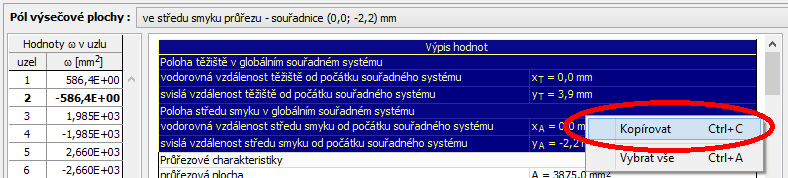 Context menu for results table