


Weak rock (Reese, Nyman, 1978)
The p-y curve for weak rock is shown in Figure 1.
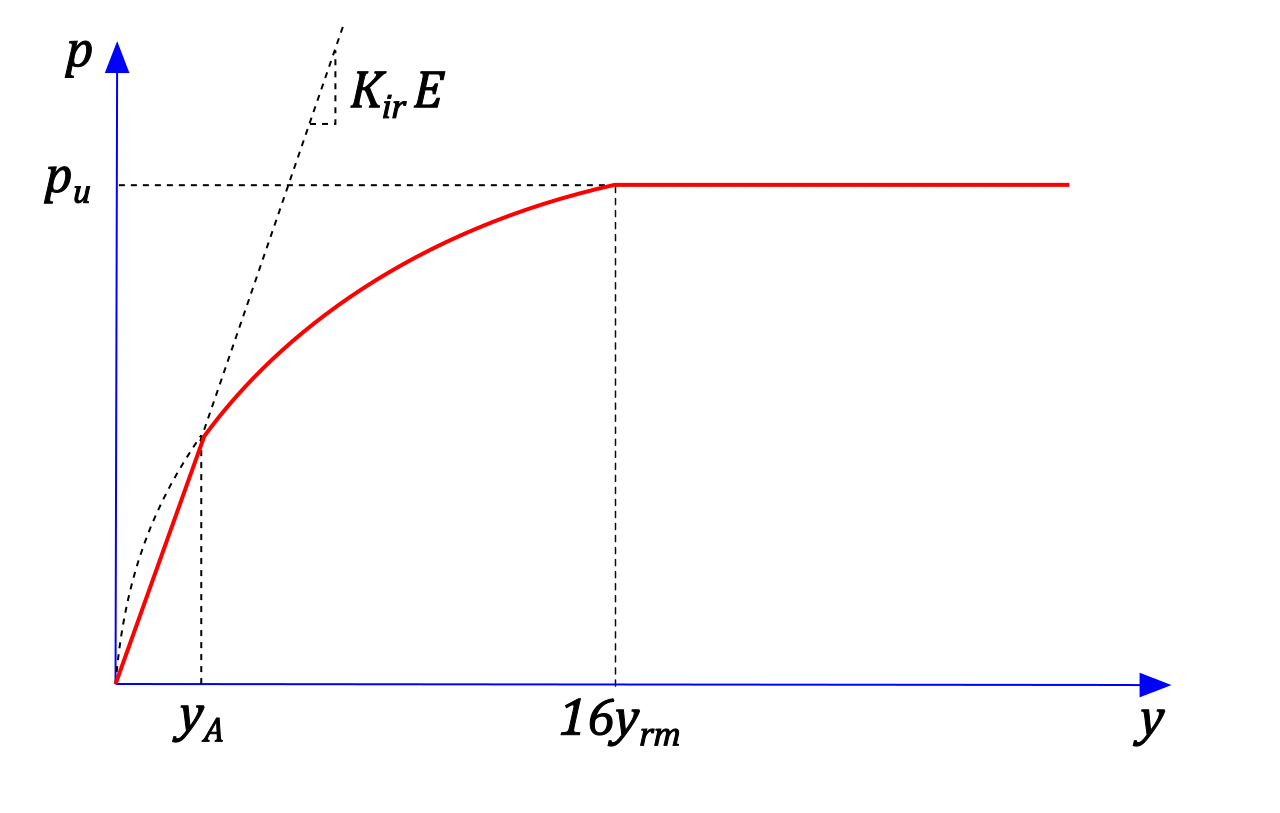 Figure 1: p-y curve for weak rock (Reese, Nyman, 1978)
The input parameters for determining the curve are:
d [m] | – | pile diameter |
z [m] | – | depth below the ground surface |
qu [MPa] | – | uniaxial compressive strength of the rock |
RQD [%] | – | rock quality designation |
E [MPa] | – | initial modulus of the rock |
εrm | – | rock strain corresponding to one-half of the ultimate resistance pu |
The curve consists of three parts:
1. Linear part defined by the initial modulus of the rock
2. Parabolic part
3. Constant part after the ultimate resistance pu has been reached
The ultimate rock resistance pu is taken as the smaller of the values:

where the strength reduction factor αr is given by:

Linear segment 1 is defined by the straight line:

where

The reference displacement yrm is given by:

The parabolic segment of the curve is described by the function:
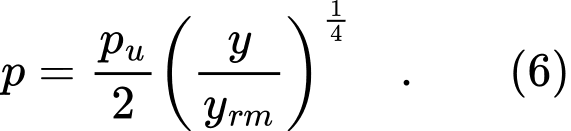
The function (6) reaches the ultimate rock resistance at a displacement of 16yrm.
The boundary between the linear and parabolic parts of the curve is the displacement yA, which is calculated as the intersection of functions (3) and (6):
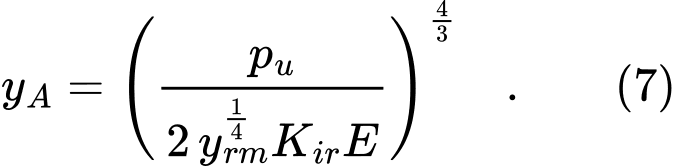
If yA is greater than 16 yrm, the parabolic part is absent and the curve is bilinear.